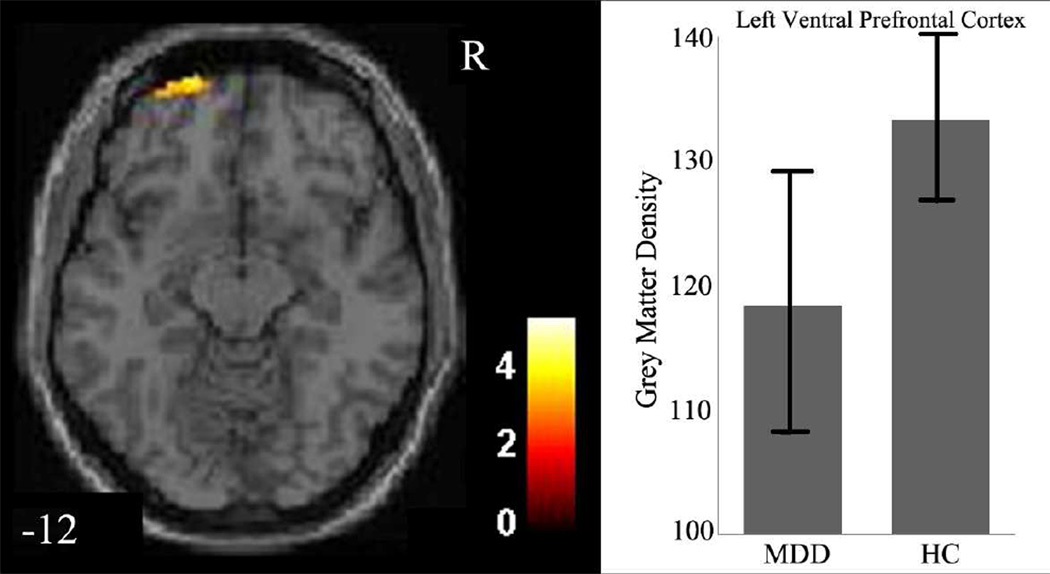
Figure 1.
Regions of decreased in gray matter density in medication-naïve participants with major depressive disorder compared to healthy controls
The axial images (z= −12mm Montreal Neurological Institute coordinate plane) show the regions of significantly decreased gray matter density in left ventral prefrontal cortex in all medication-naïve participants with major depressive disorder (MDD), compared to healthy controls (HC) (p<0.005, uncorrected). The color bar represents the range of F values. R=right
The graph shows left ventral prefrontal cortex gray matter density and standard deviation for the MDD group and the HC group.

