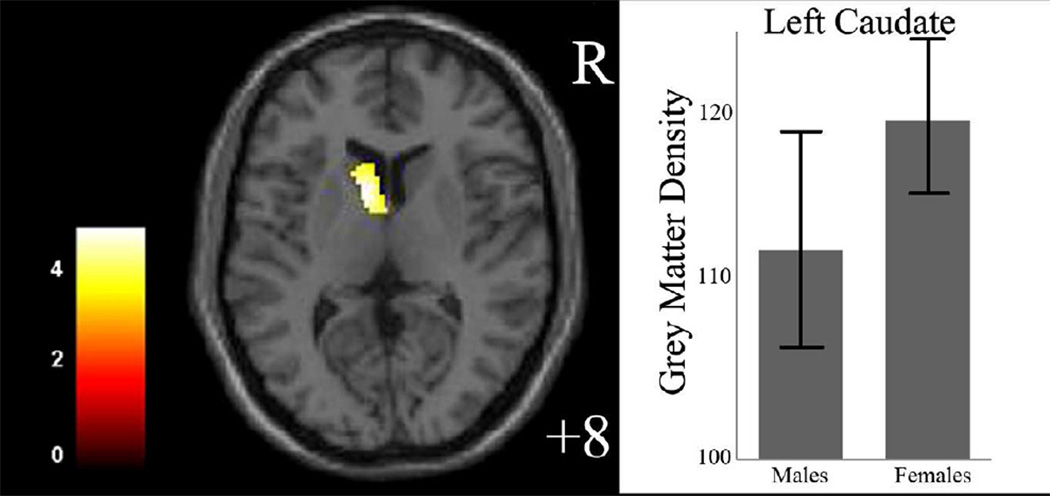
Figure 2.
Regions of differences in gray matter density between male and female participants The axial image (z= 8mm Montreal Neurological Institute coordinate plane) shows the regions of significantly decreased gray matter density in left caudate in male participants, compared to female participants (p<0.005, uncorrected).
The color bar represents the range of T values. R=right
The graph shows left caudate gray matter density and standard deviation for male and female participants.

