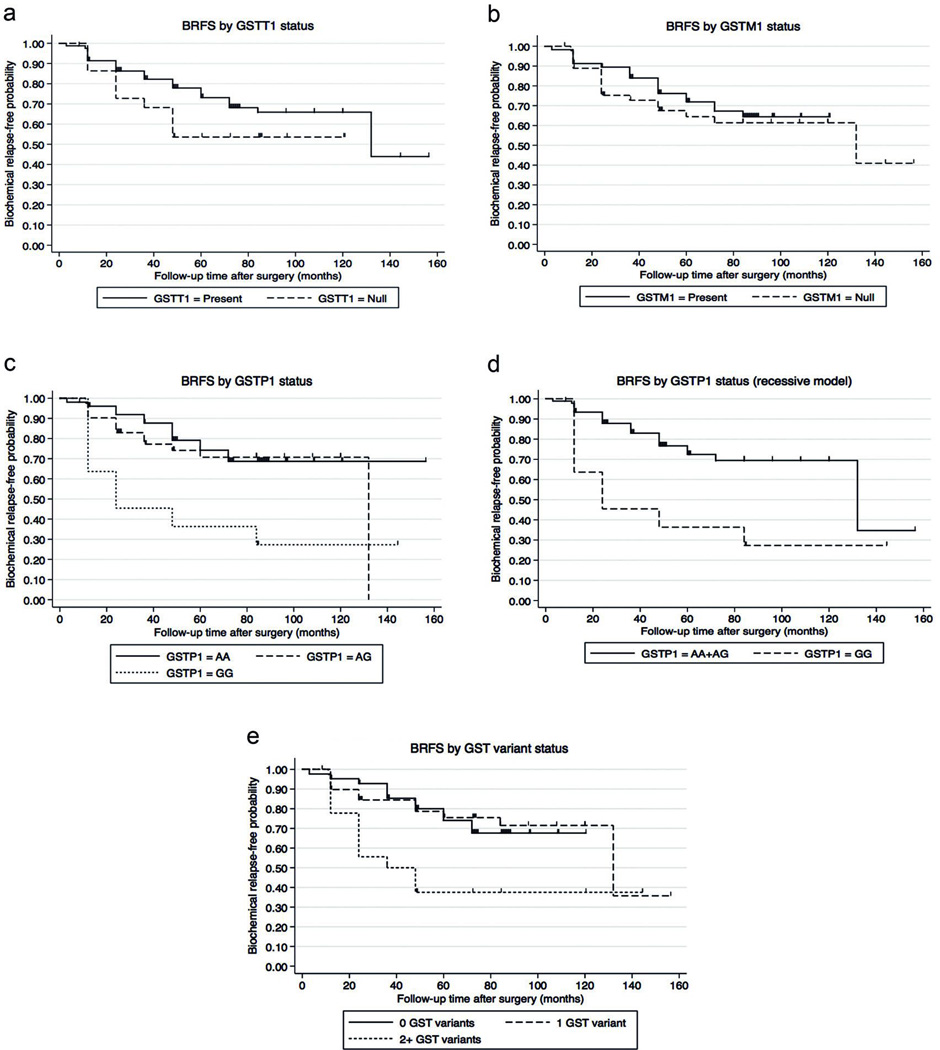
Figure 3. Biochemical-relapse free survival analysis by GST genotype.
To study biochemical-relapse free survival (BRFS), time was calculated from date of RRP to date of biochemical relapse or last follow up. The figure depicts the Kaplan-Meier survival analysis by genotypes: a) GSTT1 (log-rank p=0.1480), b) GSTM1 (log-rank p=0.4901), c) GSTP1 co-dominant model (log-rank p<0.010), d) GSTP1 recessive model (log-rank p=0.003), and e) GST combined genotype using the GSTP1 recessive model (log-rank p=0.010).

