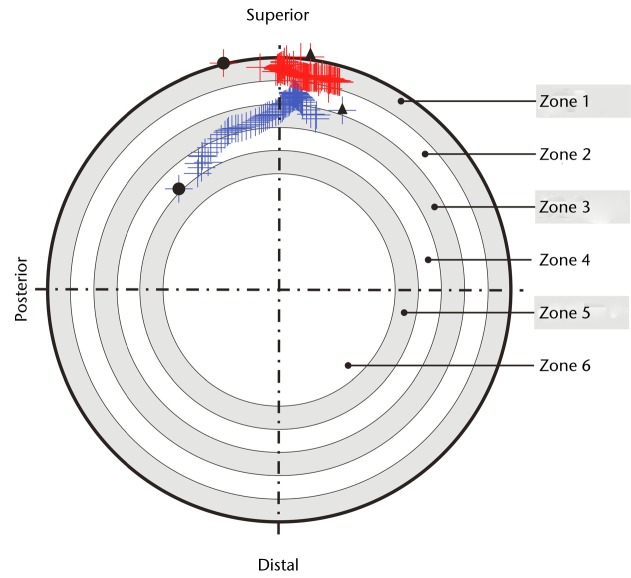
Fig. 2.
Diagram showing force paths projected on the acetabular component viewed in the direction through the centre of the component. The inner bearing surface was divided into concentric zones defined in 10% increments of the component face radius, with the zone at the edge designated as zone 1. In hip A (in blue), the force path does not enter the outer most radial zone (zone 1), thus no edge-loading is observed. In hip B (in red), during walking, the force path enters the outer most radial zone (zone 1), indicating edge-loading. The black circles (●) indicate force path at heelstrike and the black triangles (▲) indicate force path locus at toe-off.

