
Figs. 3a - 3c.
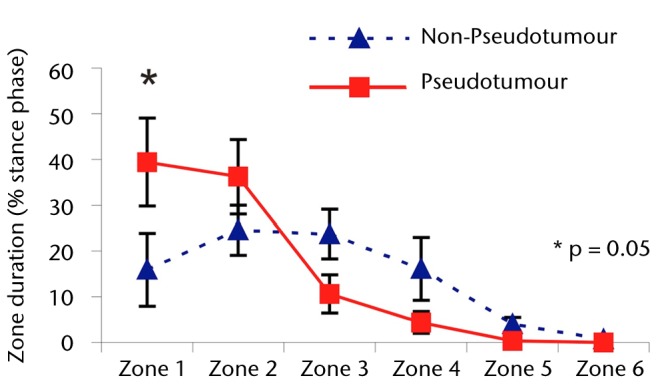
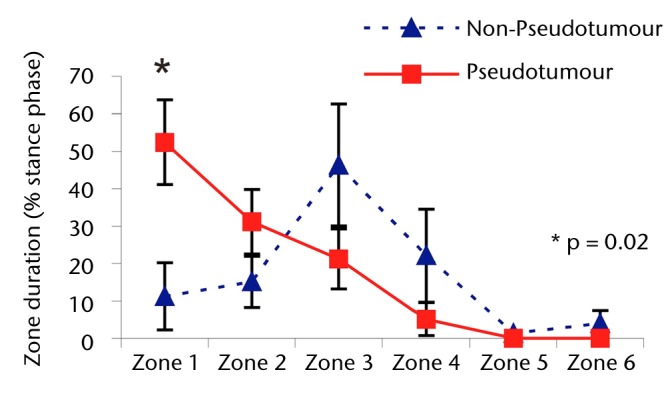
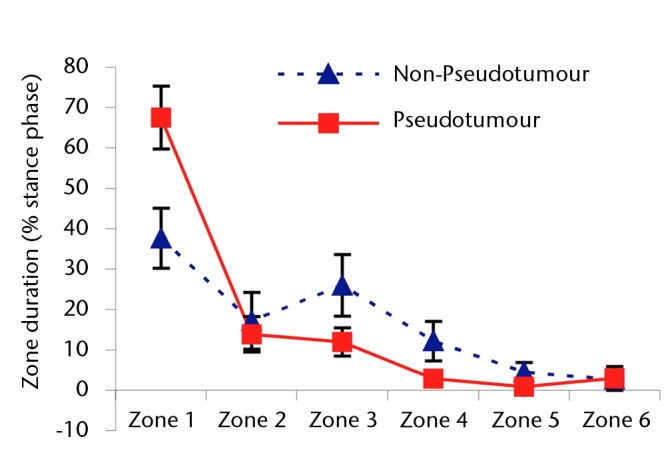
Graphs showing the distribution of ‘zone duration’ (the percentage of total stance time spent by the force path in each zone) during a) walking, b) stair climbing and c) rising from a chair. Zone 1 is defined as the edge-loading zone. The error bars represent standard errors of mean. An asterisk (*) indicates significant difference between the two MoMHRA patient groups.