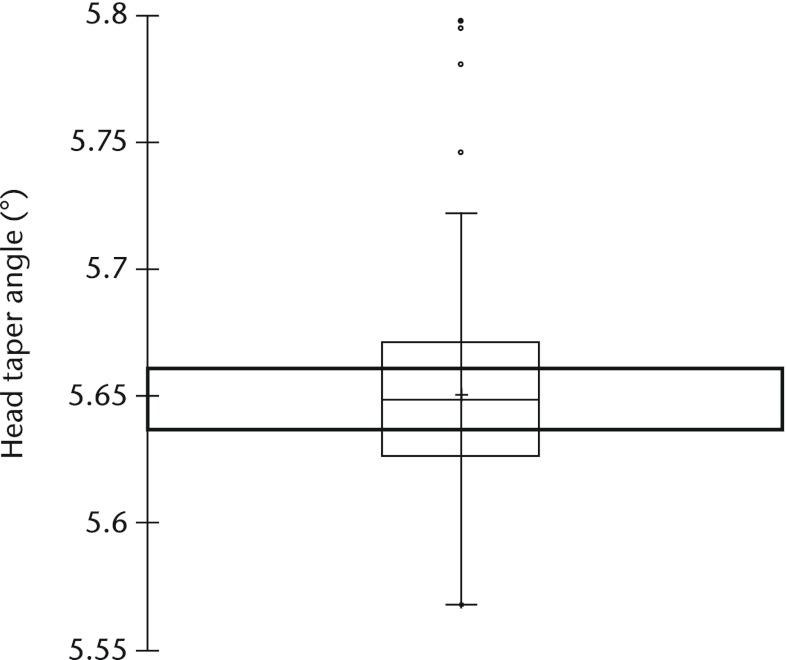
Fig. 7.
Boxplot showing the distribution of head taper angle in all retrieved implants in the study. The box represents the median value and interquartile range (IQR) and + the mean value. The whiskers correspond to the limits of the data, beyond which values are considered anomalous (°, outliers; *, extreme outliers; •, upper and lower values). The bold rectangle represents the area outside of which excessive micromotion has been shown to take place by finite element analysis.25

