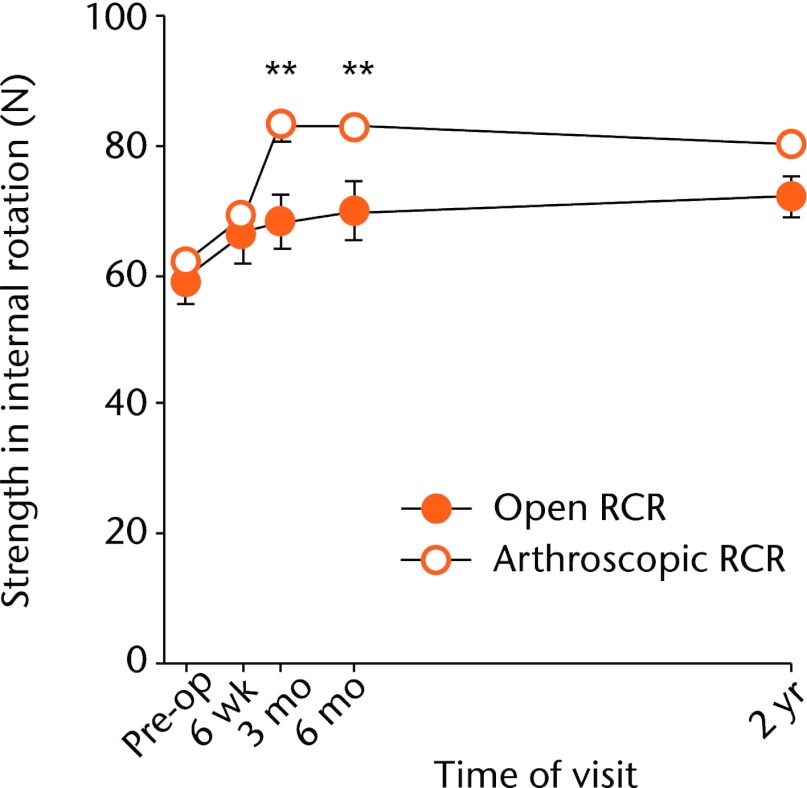
Fig. 10.
Graph showing the mean strength in internal rotation for the open and arthroscopic rotator cuff repair (RCR) groups pre-operatively and at different post-operative time-points. There was a significant difference between the groups at three months (** p = 0.003) and six months (** p = 0.004).

