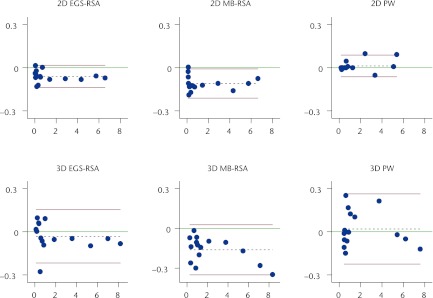
Fig. 4.

Bland-Altman plots of precision (repeatability) with 95% limits of agreement (bias with 95% repeatability limits (1.96 × √[2 × Sr]))39 for the two- (2D) and three-dimensional (3D) wear measurements with the three methods (see Table I). The x-axis shows the average of two measurements and the y-axis the difference between them (measurement 1 – measurement 2). The red lines denote the 95% repeatability limits, the dashed black line represents the bias from 0, and the green line, at y = 0, represents the line of perfect average agreement. The blue dots represent individual double measures (MB-RSA, model-based radiostereometric analysis; EGS-RSA, geometrical sphere model radiostereometric analysis; PW, PolyWare).
