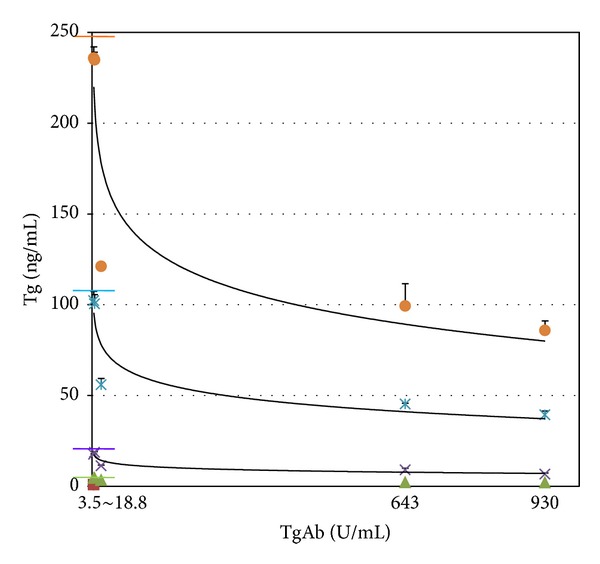
Figure 2.

Measured Tg concentration in each sample produced using patients' serum showed a proportional decline according to an increase of TgAb concentration. Transverse color bars represent expected Tg concentrations of each sample.

Measured Tg concentration in each sample produced using patients' serum showed a proportional decline according to an increase of TgAb concentration. Transverse color bars represent expected Tg concentrations of each sample.