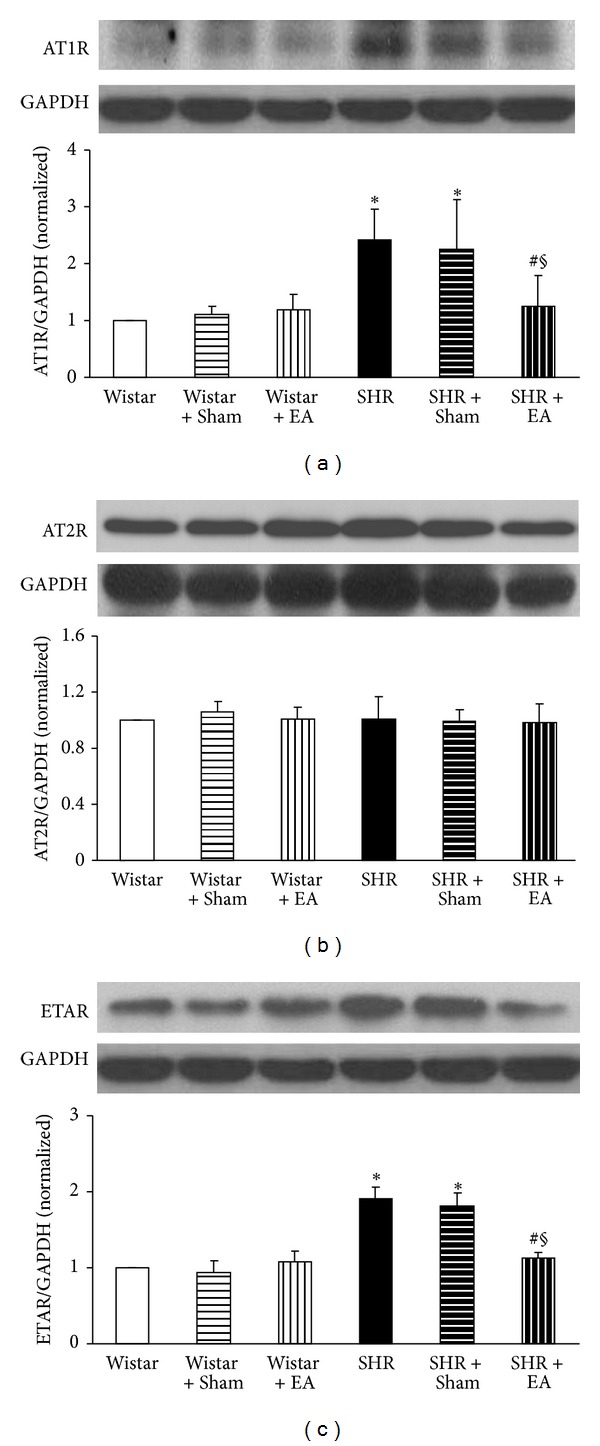
Figure 7.

The effect of electroacupuncture on expression of AT1R (a), AT2R (b), and ETAR (c) in rat cerebral tissue. For each protein, the representative Western blot of each group is presented with the respective quantification showing below. Wistar: Wistar rats without any treatment. Wistar + Sham: Wistar rats with stimulation at nonacupoints. Wistar + EA: Wistar rats with stimulation at acupoints. SHR: SHR without any treatment. SHR + Sham: SHR with stimulation at nonacupoints. SHR + EA: SHR with stimulation at acupoints. Data were expressed as mean ± SD from three animals. *P < 0.05 versus Wistar group; # P < 0.05 versus SHR group; § P < 0.05 versus SHR + Sham group.
