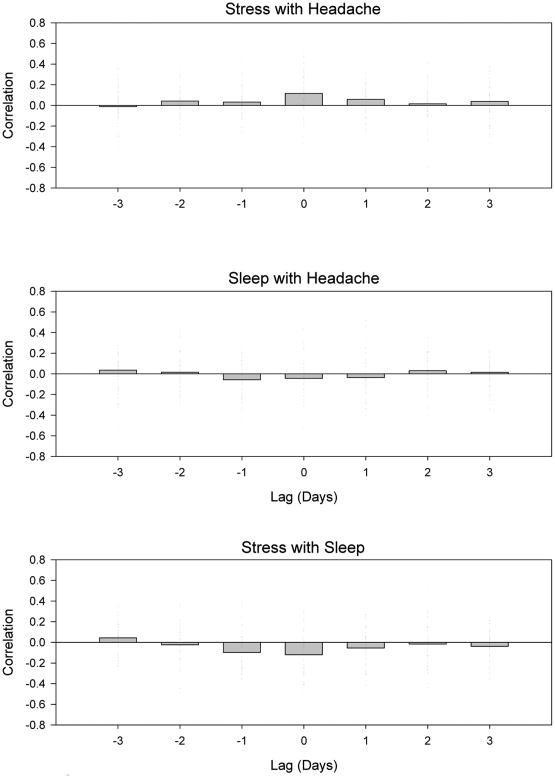
Figure 1.
Cross-correlation between stress (AIR) and headache SUM (top panel), sleep quantity and headache SUM (middle panel) and stress (AIR) and sleep quantity (lower panel). For each plot, individual tick marks represent a single subject with the y-axis displaying the Pearson correlation as a function of time lag in days. The bar plot reflects the average of individual associations.

