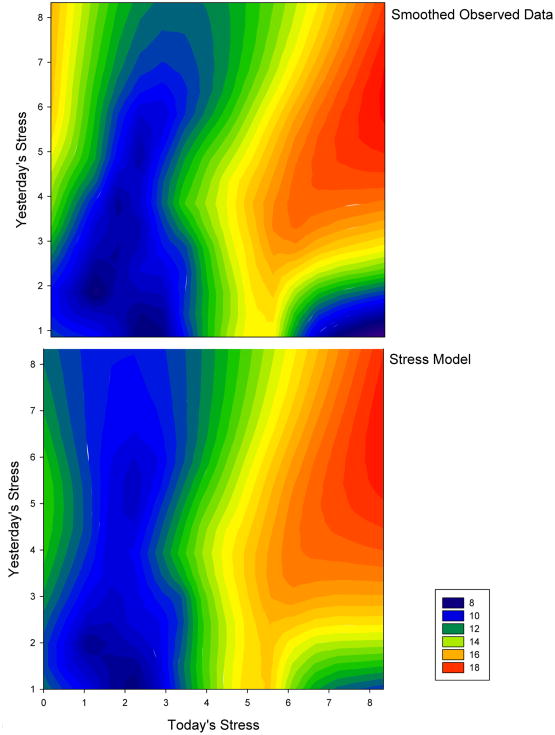
Figure 2.
A contour plot depicting the smoothed headache SUM using color as a function of today's stress (x-axis) and yesterday's stress (y-axis). The top panel displays the smoothed observed data, and the bottom panel displays the smoothed stress model predictions. The similarity between plots reflects a good fit of the model to the data.

