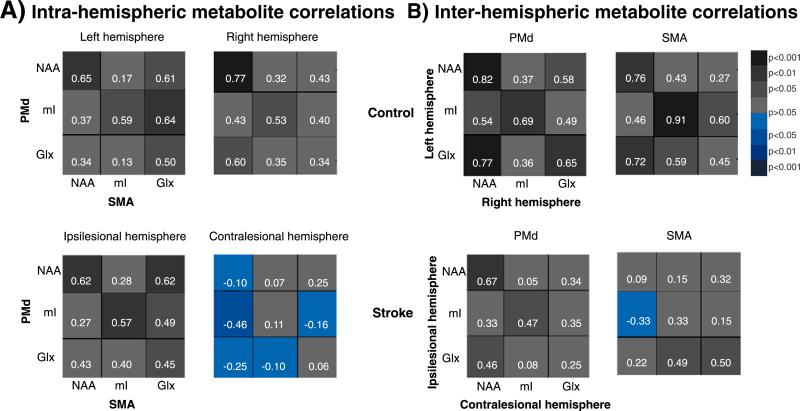
Fig. 3.
Metabolite correlation pattern between non-primary motor areas (PMd and SMA) within each hemisphere (A, intra-hemispheric), and between hemispheres within each non-primary motor area (B, inter-hemispheric), in controls (upper panels) and stroke patients (lower panels). Pearson's correlation coefficients (r, white numbers) are presented as color gradients (gray—positive, blue—negative) and the side legend represent the corresponding p-values.

