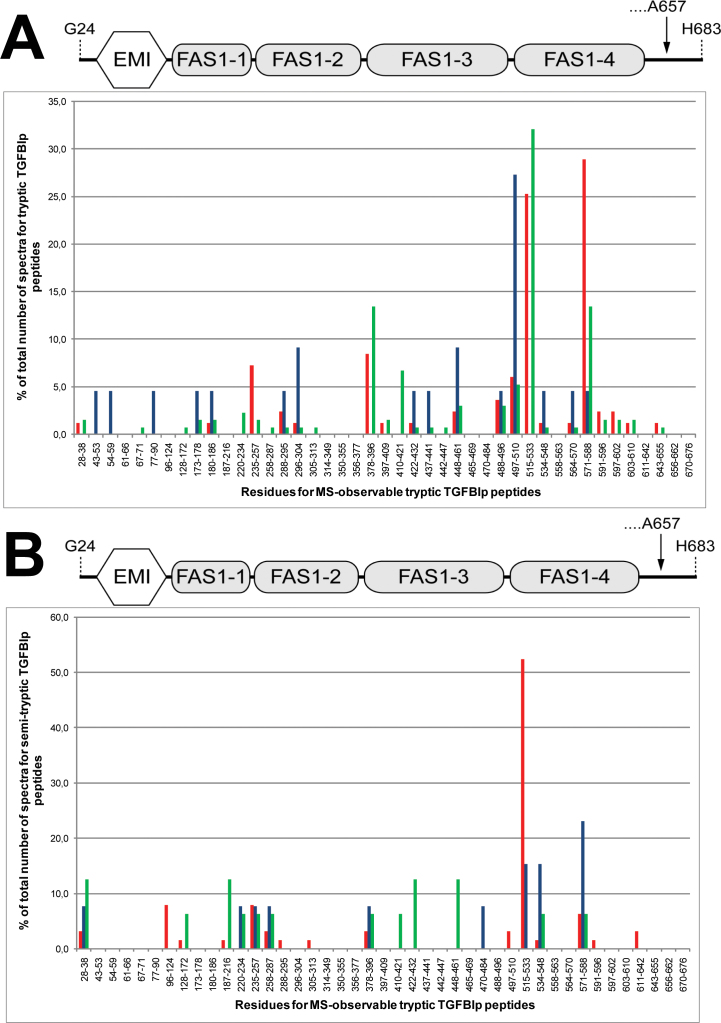
Figure 2.
Spectral count ratios for tryptic and semitryptic transforming growth factor beta induced protein (TGFBIp) peptides. Spectral count ratios for tryptic TGFBIp peptides (A) and semitryptic TGFBIp peptides (B) detected in the amyloid deposits (red bars), periamyloid corneal tissue (blue bars), and healthy stroma (green bars). The spectral count ratios are plotted for each mass spectrometry (MS)-observable tryptic TGFBIp peptide with no missed cleavages. In the amyloid deposits, the highest spectral count ratios for tryptic peptides were observed for Y571-R588 and F515-R533 located in the fourth fasciclin 1 (FAS1-4) domain. Other tryptic TGFBIp peptides with relatively high spectral count ratios (V235-R257 and T378-R396) were located at the inter-domain regions. For the semitryptic peptides, the highest spectral count ratio was for peptide F515-R533. In the periamyloid corneal tissue, the highest spectral count ratio for tryptic TGFBIp peptides was observed for peptide V497-K510. For the semitryptic TGFBIp peptides in the periamyloid tissue, the highest spectral count ratio was for residues Y571-R588. No tryptic or semitryptic peptides from the C-terminal region covering residues S591-K676 of TGFBIp were detected in the periamyloid corneal tissue. The schematic drawing above the bar charts shows the domain structure of TGFBIp to illustrate the locations of the peptides. The structure includes the N-terminal EMILIN domain (EMI, residues 45–99) and the four consecutive fasciclin 1 (FAS1) domains (FAS1–1: residues 103–235; FAS1–2: residues 242–371; FAS1–3: residues 376–498; and FAS1–4: residues 505–632). The arrow indicates that the major isoform of TGFBIp in the human cornea is cleaved at the C-terminus of residue A657.

