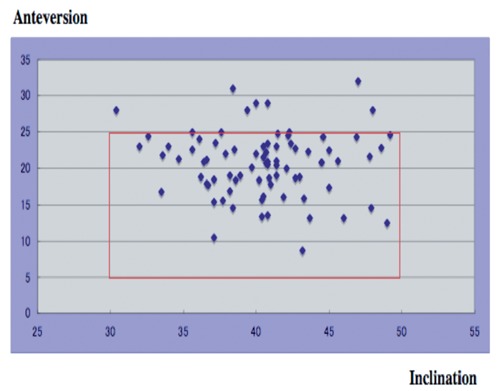
Figure 1.

Scatter plots showing anteversion and X-ray inclination of the cup. Post-operative cup anteversion and inclination in each patient are presented by a dot. Range of Lewineck's safe zone is shown by the solid square. Cup alignment in 72 cases (91.1%) fell within Lewinnek's safe zone.
