Figure 3.

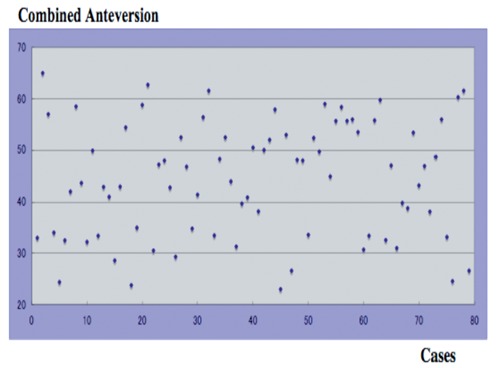
Scatter plots showing combined anteversion. Distribution of combined anteversion values were scattered as shown by large standard deviation values (range 23.0–65°).

Scatter plots showing combined anteversion. Distribution of combined anteversion values were scattered as shown by large standard deviation values (range 23.0–65°).