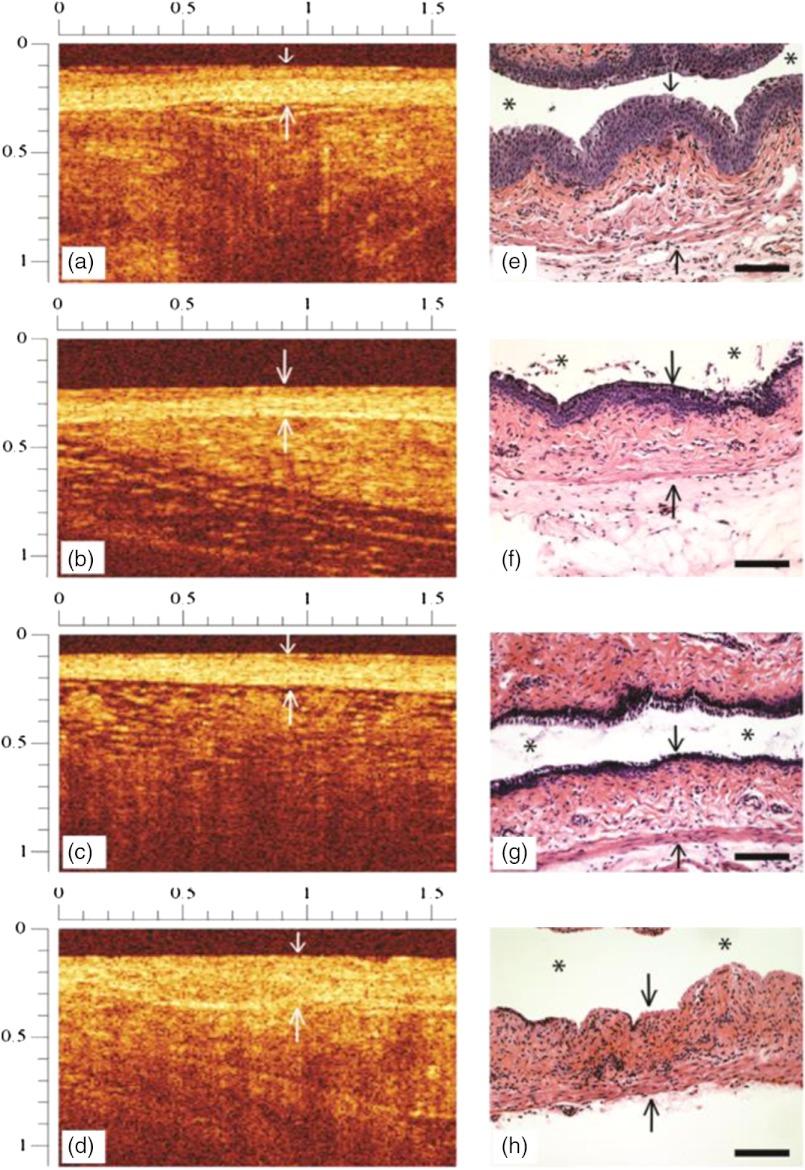
Fig. 2.
Representative OCT images (a–d) and corresponding histology (e–h) from mice treated with phosphate buffered saline (PBS) (a, e), 0.02% benzalkonium chloride (BZK) (b, f), 0.2% BZK (c, g), or 2% BZK (d, h). Downward-pointing white arrows in the upper dark region of the OCT images (a–d) indicate the transition point between OCT probe tip window and the vaginal epithelial surface. Black arrows denote the epithelial surface in the histology microphotographs (e–h). The lower, upward directed arrows indicate the location of the stromal margin. The intravaginal lumen is indicated by asterisks (*) in the histology photomicrographs. Top and left OCT image rulers are in mm. In histology microphotographs, .

