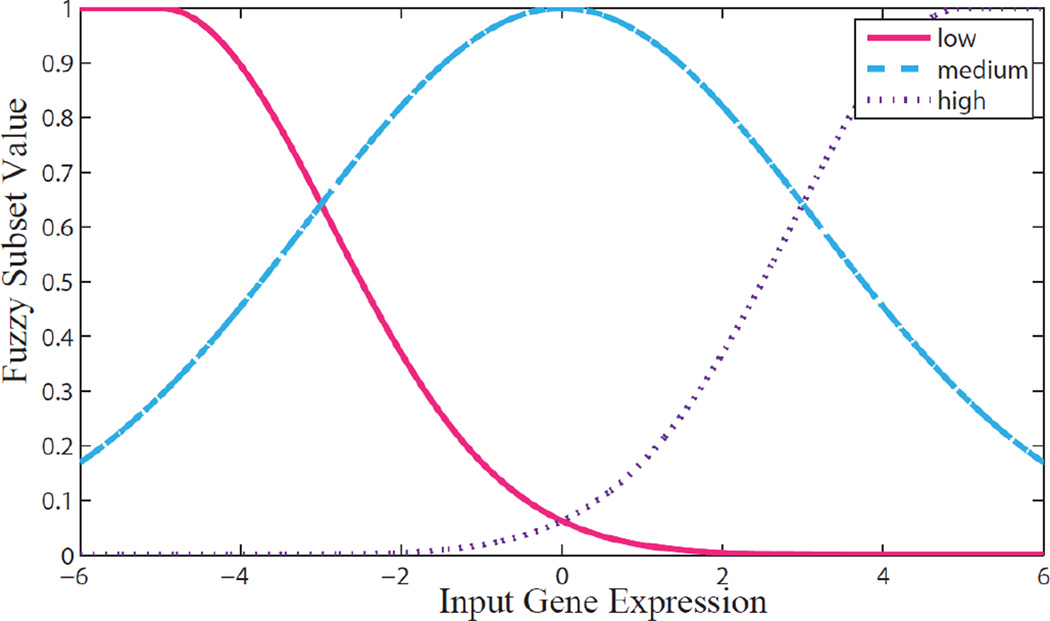
Fig. 2.
Graph of membership functions used to fuzzify input genes. Note that the scale parameter of the medium Gaussian membership function is larger than low and high membership functions (7.5, 5, and 5, respectively), increasing bias towards control level predictions. Low, medium, and high membership values are related to the likelihood that a treatment group is expressed below, at, or above the control treatment group, respectively, given the observed expression level.

