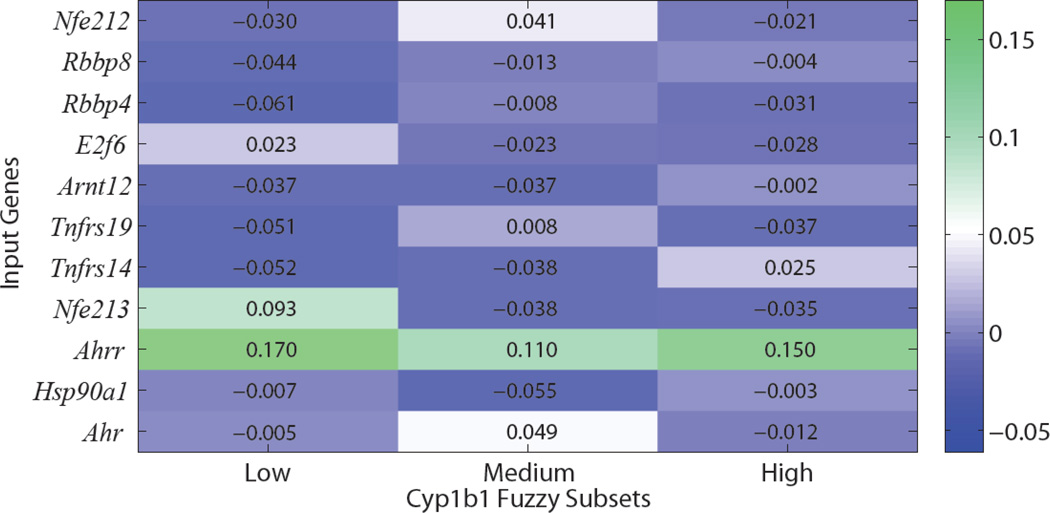
Fig. 4.
Heatmap of percent gene input weights for low, medium, and high Cyp1b1 prediction in the 1st, 2nd and 3rd columns, respectively. Weights are normalized relative to the average (mean) input weight (9.09%). Dark green indicates an above average (higher) relative input weight, whereas dark blue indicates a below average (lower) relative input.

