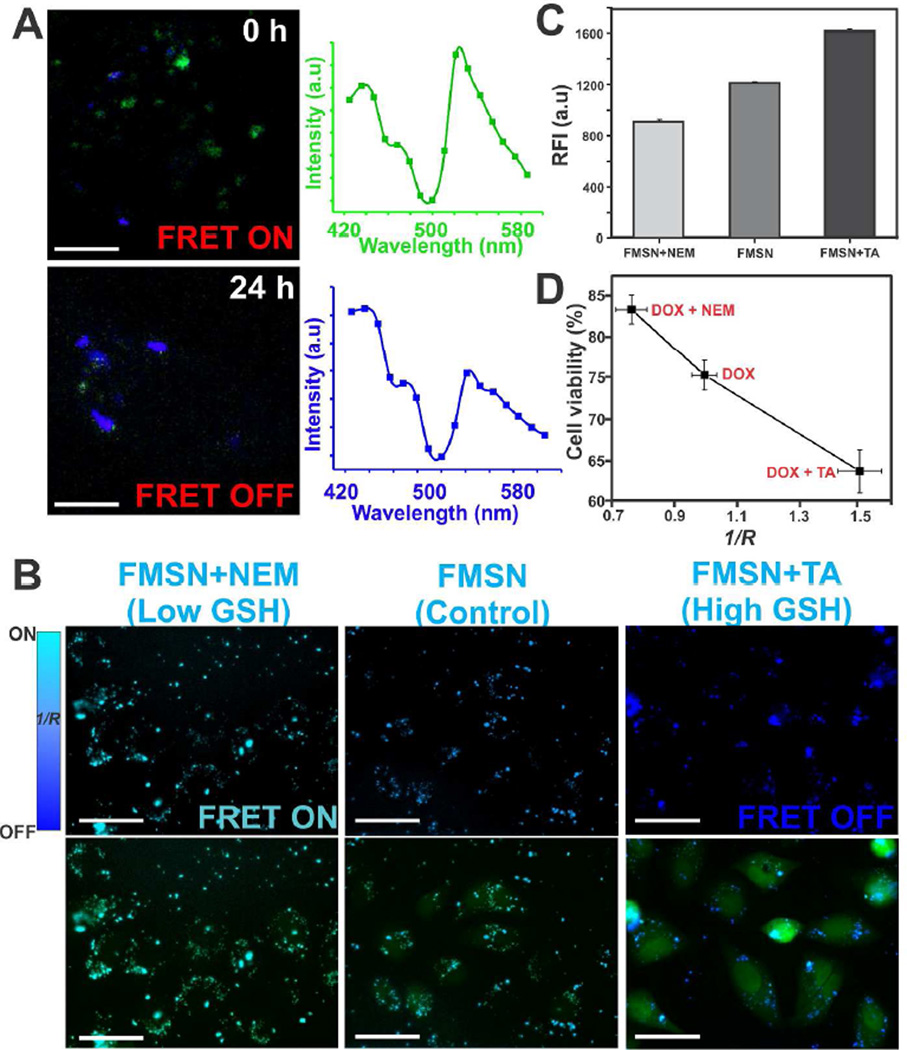
Figure 5.
(A) Confocal microscopy images (Left panel) depicting the change in FRET signal in HeLa cells treated with FRET-MSNs at different time points. Right panel shows the corresponding change in the average fluorescence intensities, when the cells were excited with 405 nm light (more details see Figure S7). Scale bar is 1 µm. (B) Fluorescence microscopy images showing the change in the fluorescence intensity (FRET channel, 405 nm excitation, top panel, and the merged images with FITC channel which used 488 nm as excitation, bottom panel) upon varying intracellular GSH concentration of HeLa cells, prior to treatment with FRET-MSNs. Cells treated with N-ethyl maleimide (NEM, 5 µM) present low levels of GSH, thereby FRET signal is on; whereas, the cells treated with thiotic acid (TA, 10 µM) have increased GSH levels and hence the FRET is turned off. The bar (top left corner) indicates the correlation between FRET signal R and the color of the FRET-MSNs seen in the top panel. Scale bar is 5 µm. (C) Quantitative comparison of the relative fluorescence intensities (RFI, Ex = 405 nm, Em = 450 nm), of the HeLa cells treated with TA and NEM. (D) Correlation between FRET signal R and cell viability, when the HeLa cells were treated with DOX loaded FRET-MSNs at varying GSH concentrations.

