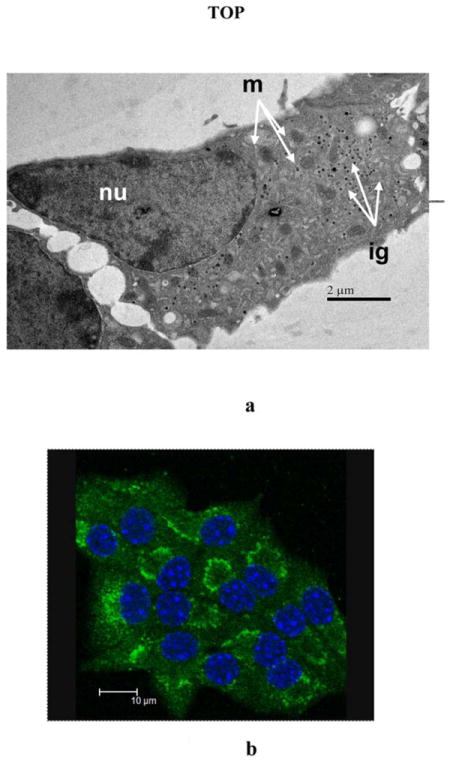
Figure 4. Representative SEM and Fluorescent staining of MIN-6 cells.

a)SEM micrograph of an ultra-thin section of MIN-6 cells. MIN-6 cells incubated with 50 μM MnCl2 and 2mM glucose, 16 mM glucose, or 16mM glucose and 30mM KCl were fixed with osmium tetroxide and stained with uranyl acetate. A representative cell from the 50 μM MnCl2 and 16mM glucose sample is shown. Among the cellular structures clearly visible are the nucleus (nu), mitochondria (m), and insulin granules (ig). b) Fluorescent staining of Golgi apparatus in MIN-6 cells. Golgi apparatus shown as intense green areas in MIN-6 cells was stained with green-fluorescent Alexa Fluor® 488 conjugate of HPA lectin. Nuclei were counterstained with DAPI.
