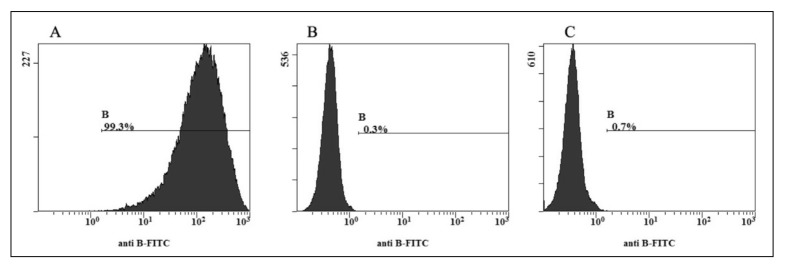
Figure 1.
FACS analysis of A2 RBC converted from A2B cells. The FACS histograms show the B antigen site density as measured by anti-B fluorescein isothiocyanate-labelled monoclonal antibody on A2B (A), native (B) and enzymatically converted A2 RBC (C). The x-axis represents the fluorescence intensity on a logarithmic scale, whereas the y-axis shows the number of RBC evaluated. The antibody diluting concentration was 1:128. The native A2B showed a higher positive rate, 99.3%, but native A2 and enzymatically converted A2 RBC gave low positive rates of 0.3% and 0.7%, respectively.

