
Figure 1.
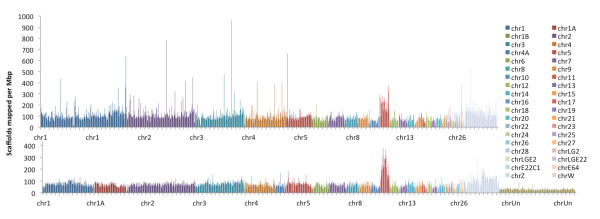
Density of theA. vittatascaffolds that shared similarity with fragments of chicken and zebra finch genomes (Top) Chicken (G. gallusgenome (per Mbp) and (Bottom) zebra finch (T. guttata) genome (per Mbp). Different chromosomes are represented by different colors as shown in the legend on the right. Chromosomal locations, lengths and quality of alignments to the two genomes by BLAST are presented in Additional file 6: Table S4.