
Figure 2.
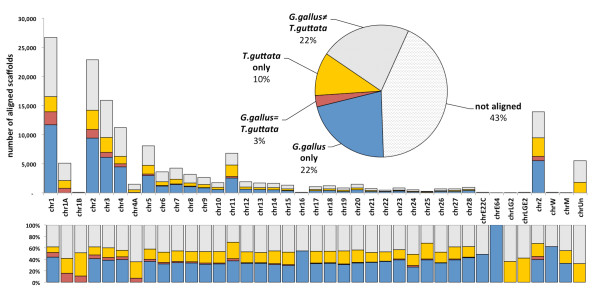
Proportion of sequences with some similarity across the two avian genomes (G. gallusandT. guttata).A. vittata scaffolds are classified into five categories (A) unmapped - those that were not found any similar sequence, (B) chicken only – those that shared similarity only with a fragment of G. gallus genome; (C) finch only – those that shared similarity only with a T. guttata genome; (D) mismatched – those scaffolds that shared similarity with sequences of G. gallus and T. guttata genomes but mapped to different chromosomes in the two species; (E) matched – those that mapped to the same chromosome in reference genomes of the two avian species. Proportions are represented as totals (pie chart), absolute numbers (top) and proportions per chromosome (bottom). The associated data are provided in Additional file 9: Table S5.