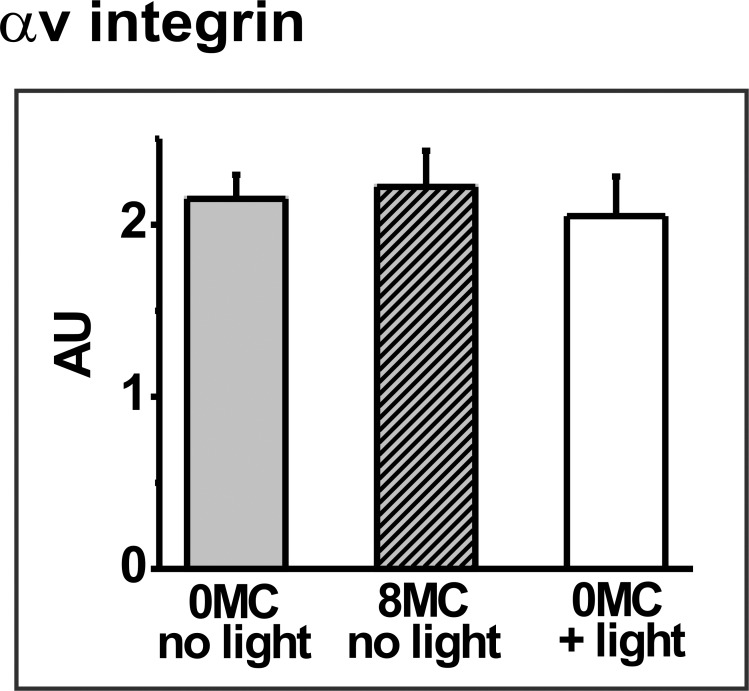
Figure 5.
Densitometric analysis of the blotting signal for the αv integrin subunit in control (untreated) ARPE-19 cultures (grey bar), in nonirradiated cultures preloaded with 8 μM MC-540 (hatched grey bar), or in cultures light irradiated for 30 minutes without photosensitizer (white bar). Data are the mean band densities, given in AU, from extracts prepared 0.5 hours after light treatment for triplicate culture wells from each group in a representative experiment; error bars indicate SD. Outcomes do not differ significantly (t-test analyses).

