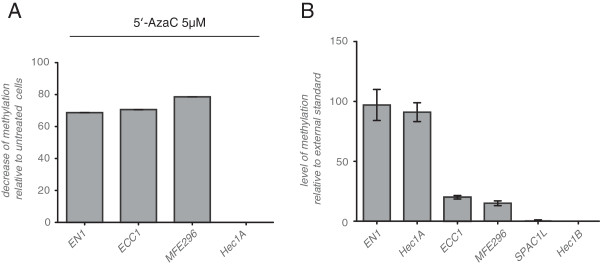
Figure 3.

MethyLight analysis of promoter 1 of the L1CAM promoter region. (A) The indicated cell lines were treated with 5-AzaC or DMSO and the L1CAM promoter was subjected to MethyLight PCR. (B) MethyLight analysis of the L1CAM promoter region in EC cell lines. The analyzed region comprised fragment PP1 (see Figure 4A).
