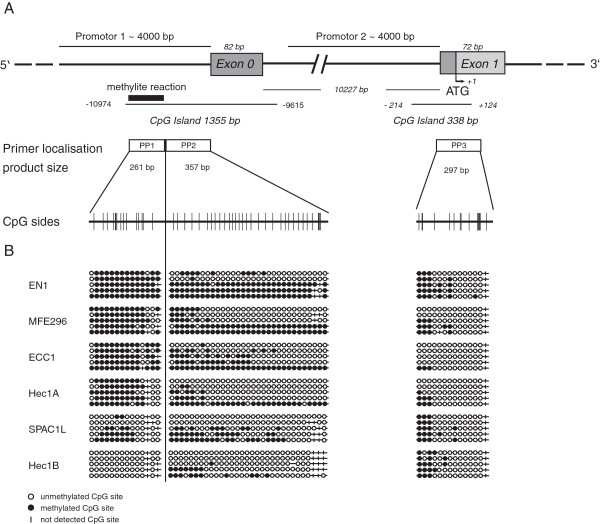
Figure 4.
Methylation of the L1CAM promoter in EC cell lines. (A) Schematic illustration of the L1CAM promoter region according to the Ensembl database. Exon 1 contains the ATG and the transcription start sites. The upstream sequence of appr. 4100 bp was identified as promoter 2. The non-coding Exon 0 (82 bp) is located appr. 10 kb upstream and is followed by an appr. 4.5 kb promoter region (promoter 1). CpG islands are also indicated. PP1, 2 and 3 indicates fragments that were analysed by sequencing after bisulfite conversion. CpG sides are indicated. (B) Schematic illustration of methylation sides in promoter 1 and promoter 2 of the cell lines analysed.

