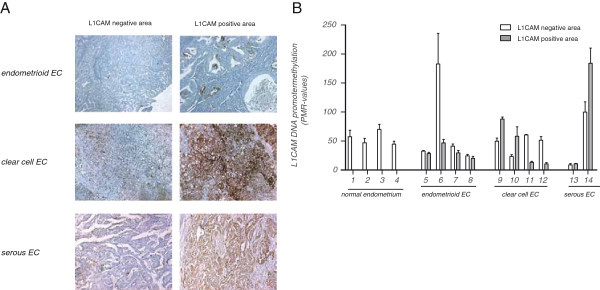
Figure 5.

L1CAM promoter Methylight analysis of EC tumor tissues. (A) Representative staining examples of EC tissues with L1CAM negative and L1CAM positive staining areas. (B) Results of the Methylight reaction from paired tumor samples and normal endometrium (numbered from 1 to 14) are shown. DNAs were extracted from punched areas (1 mm diameter) that were selected according to IHC staining. Note that normal endometrium is L1CAM negative.
