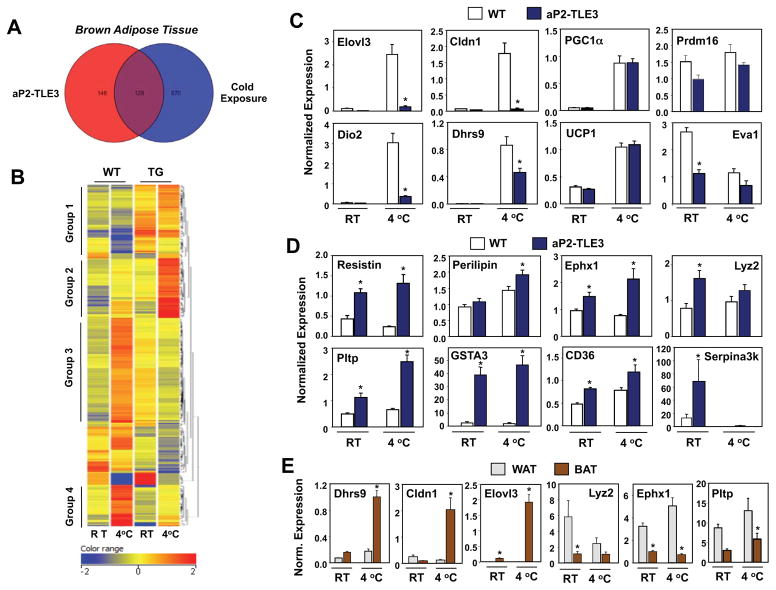
Figure 3. Transcriptional reprogramming of the BAT thermogenic gene program by TLE3.
A. BAT cDNA from control and aP2-TLE3 Tg mice house at RT or 4 °C was analyzed by hybridization to Affymetrix GeneChip Mouse Gene 1.0 ST Arrays. Data was processed using GeneSpring software as described in Experimental Procedures. Venn diagram depicting overlap between genes altered greater than 2-fold by TLE3 or cold exposure. B. Heat map representation and cluster analysis of genes altered greater than 2-fold between control and aP2-TLE3 Tg BAT as determined by Affymetrix arrays. A complete list of genes in each grouping is provided in Supplemental Table 1. C. Realtime PCR analysis of the expression of genes selective for BAT in control and aP2-TLE3 Tg BAT (N=4–7/group). D. Realtime PCR analysis of the expression of genes selective for WAT in control and aP2-TLE3 Tg BAT (N=4–7/group). E. Realtime PCR analysis of gene expression in WAT and BAT from C57BL/6 mice (N=6–8/group). Data are presented as mean +/− SEM. *P < 0.05. Significance was analyzed by two-way ANOVA followed by Bonferroni post-hoc test.

