
Figure 5.
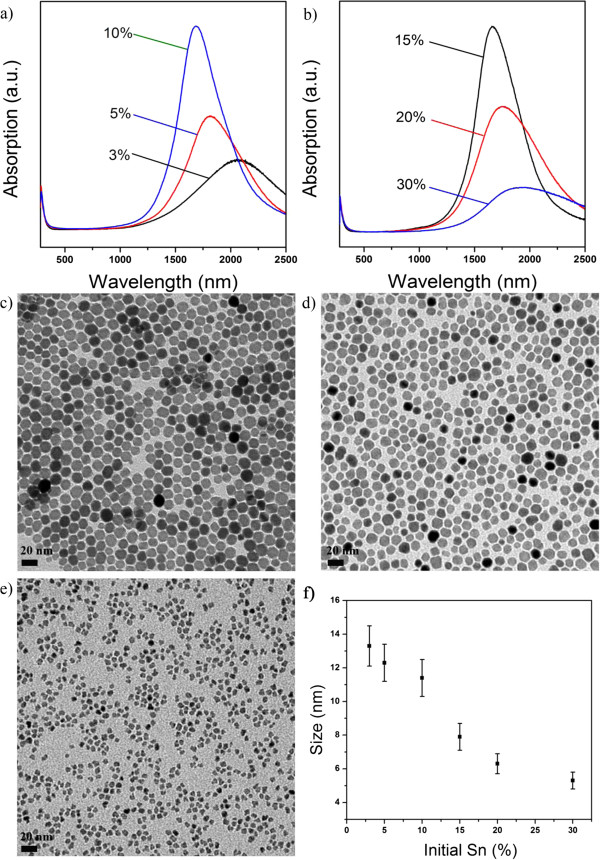
ITO nanocrystals from the hot-injection approach. (a and b) UV-vis-NIR spectra of ITO nanocrystals starting with different molar ratios of tin precursors. (c, d, and e) Typical TEM images of ITO nanocrystals starting with 3, 5, and 30 mol.% of tin precursors, respectively. (f) The corresponding size distribution of ITO nanocrystals.