
Figure 3.
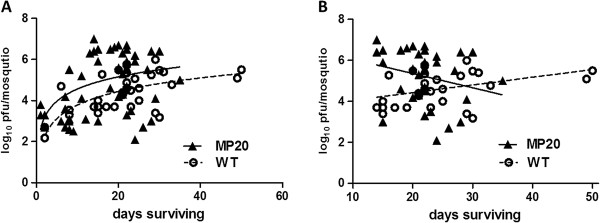
WNV loads in Cx. pipiens at the time of death. (A) Individual WNV titers for all infected mosquitoes and best-fit nonlinear relationship between survival and geometric viral titers. (B) Relationship between WNV titers and survival beginning at 14 days post-infection and best fit linear relationship between survival and geometric viral titers. Slopes of lines differed significantly (linear regression analysis, p=0.009) and a negative correlation between days surviving and viral load was measured for MP20-susceptible mosquitoes (Correlation analysis, Pearson r= −0.36, p=0.038).