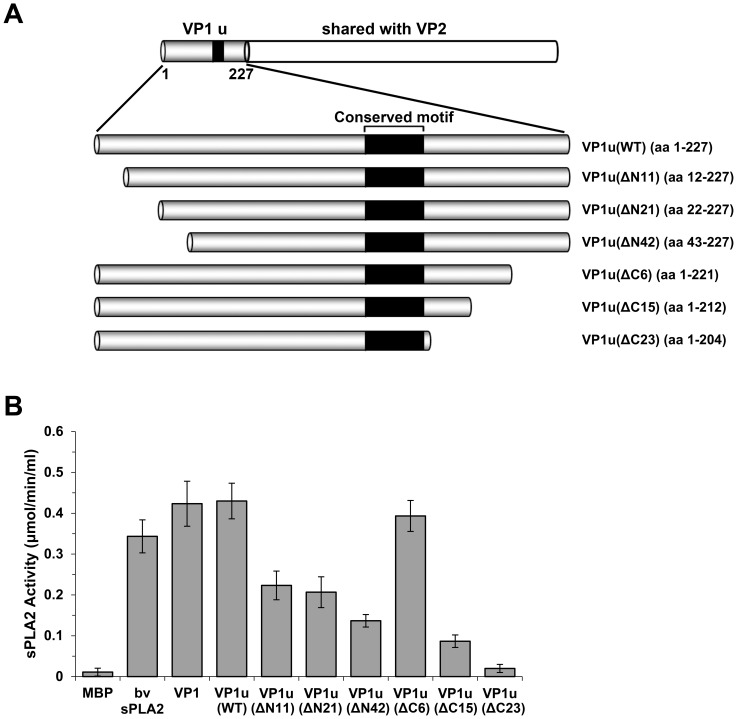
Figure 2. PLA2 activity of different truncated VP1 mutants.
(A) Schematic representation of the truncated VP1u region. Six plasmids were constructed to express the C-terminal and N-terminal truncated proteins. The amino acid numbers of the proteins are shown in parentheses. The VP1u region is illustrated at the top. (B) The PLA2 activity of different truncated VP1u proteins. Truncated VP1u proteins, 10 µg of each; bee venom, 10 ng. Data are representative of three independent experiments.

