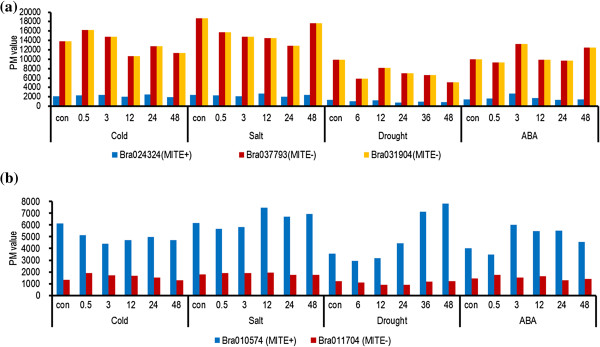
Figure 5.

Comparison of expression profiles between genes with BRAMI-1 insertions and their NIPs. (a) Expressions of Bra024324 and its two NIPs, Bra031904 and Bra037793, were analyzed by searching a microarray database of B. rapa treated with cold (4°C), salt (250 mM NaCl), drought (air-drying), or ABA (100 μM). (b) Expression of Bra010574 and its NIP, Bra011704, were compared. MITE+ and MITE- indicate genes with the BRAMI-1 insertion and their NIPs, respectively.
