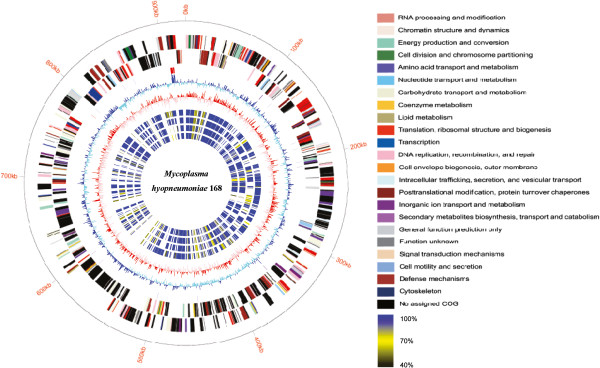
Figure 1.

Genome architecture. The dnaA gene is at position zero. Moving inside, the first circle shows the genome length (units in M. hyopneumoniae); the second and the third circles show the locations of the predicted CDSs on the plus and minus strands, respectively, which were color-coded by COG categories (the color codes for the functional assignments are shown in the key); the fourth circle shows tRNAs (purple) and rRNAs (red); the fifth circle shows the centered GC (G+C) content of each CDS (blue: above mean and cyan: below mean); and the sixth circle shows the GC (G+C) skew plot (red: above zero and pink: below zero). Circles 7–10 show comparative amino acids analysis of 168 with amino acids identities color-coded according to the similarity shown in the key to strains 168-L (seventh circle), 232 (eight circle), J (ninth circle), 7448 (tenth circle).
