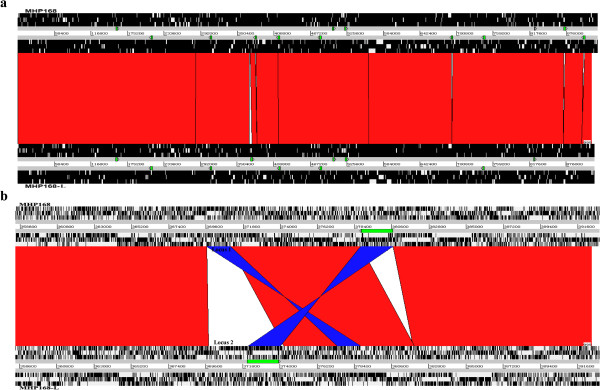
Figure 2.
Alignment of the whole genomes and inverted regions. (a) Alignment of the M. hyopneumoniae 168 and 168-L genomes. (b) Alignment of the inverted regions of 168 relative to 168-L. The gray bars represent the forward and reverse strands. Green triangles represent ISMHP1 elements. DNA BLASTN alignments (BLASTN matches) between the two sequences are indicated by a red (same strand) or blue (opposite strand) line.

