
Figure 1.
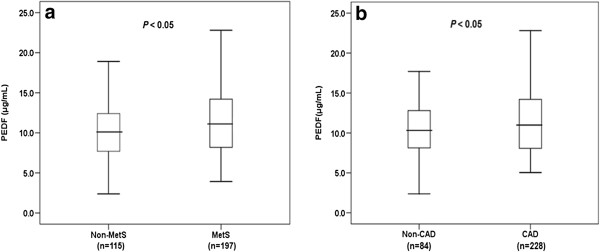
Comparison of serum PEDF levels between study participants with and without MetS (a) and CAD (b). The bars represent median, 25th and 75th percentile of PEDF level.
Official websites use .gov
A
.gov website belongs to an official
government organization in the United States.
Secure .gov websites use HTTPS
A lock (
) or https:// means you've safely
connected to the .gov website. Share sensitive
information only on official, secure websites.
Comparison of serum PEDF levels between study participants with and without MetS (a) and CAD (b). The bars represent median, 25th and 75th percentile of PEDF level.