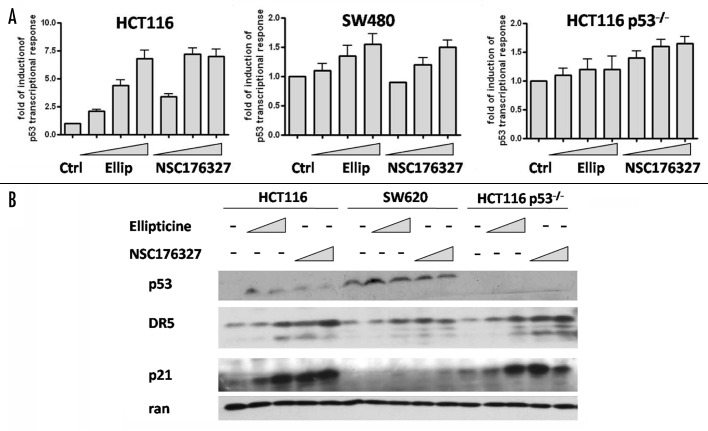
Figure 5. (A) HCT116, SW480 and HCT116 p53−/− cells were treated with different concentrations of ellipticine or NSC176327 for 12 h and fold induction of p53 transcriptional response was measured by bioluminescence imaging of human p53 reporter, PG-13-luc. (B) HCT116, SW620 and HCT116 p53−/− cells were treated with different concentrations of ellipticine or NSC176327 for 16 h and protein expression level of p53, p21 and DR5 was determined by western blot. Ran was included as loading control.

An official website of the United States government
Here's how you know
Official websites use .gov
A
.gov website belongs to an official
government organization in the United States.
Secure .gov websites use HTTPS
A lock (
) or https:// means you've safely
connected to the .gov website. Share sensitive
information only on official, secure websites.
