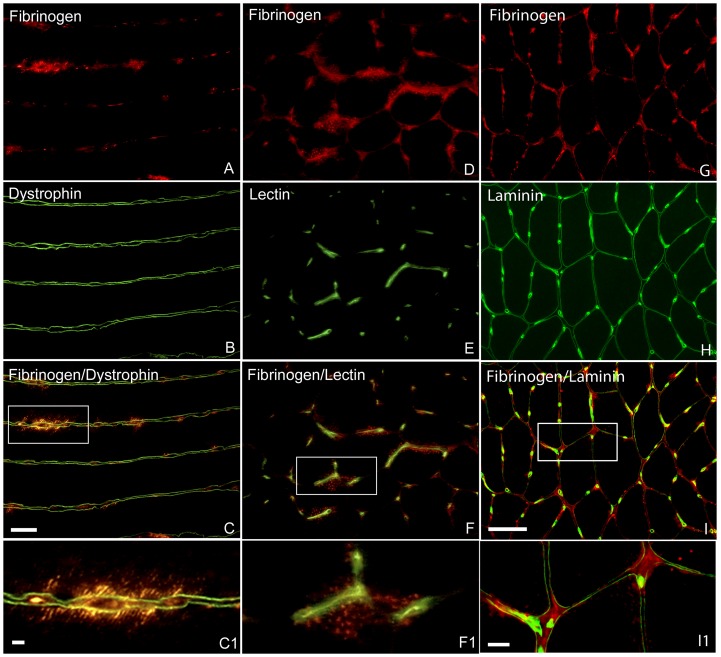
Figure 2. Immunofluorescence staining for visualization of muscle fibre sarcolemma integrity.
A–C, one longitudinal section from a biopsy of 1 h group double stained for fibrinogen (A) and dystrophin (B). C is merged images of A and B, and C1 is enlargement of boxed areas in C. Several sites of intracellular staining for fibrinogen outlined by dystrophin were seen along the length of a fibre, whereas staining for dystrophin did not reveal distinct disruption of plasma membrane. D–F, one transverse section from a biopsy of 1 h group double stained for fibrinogen (D) and lectin (E). F is merged images of D and E, and F1 is enlargement of boxed areas in F. Intracellular staining for fibrinogen was seen close to capillaries revealed by lectin staining. G–I, one transverse section from a biopsy of control group double stained for fibrinogen (G) and laminin (H). I is merged images of G and H, and I1 is enlargement of boxed areas in I. Several sites of distinct extracellular staining for fibrinogen outlined by laminin were seen. Bars 50 µm

