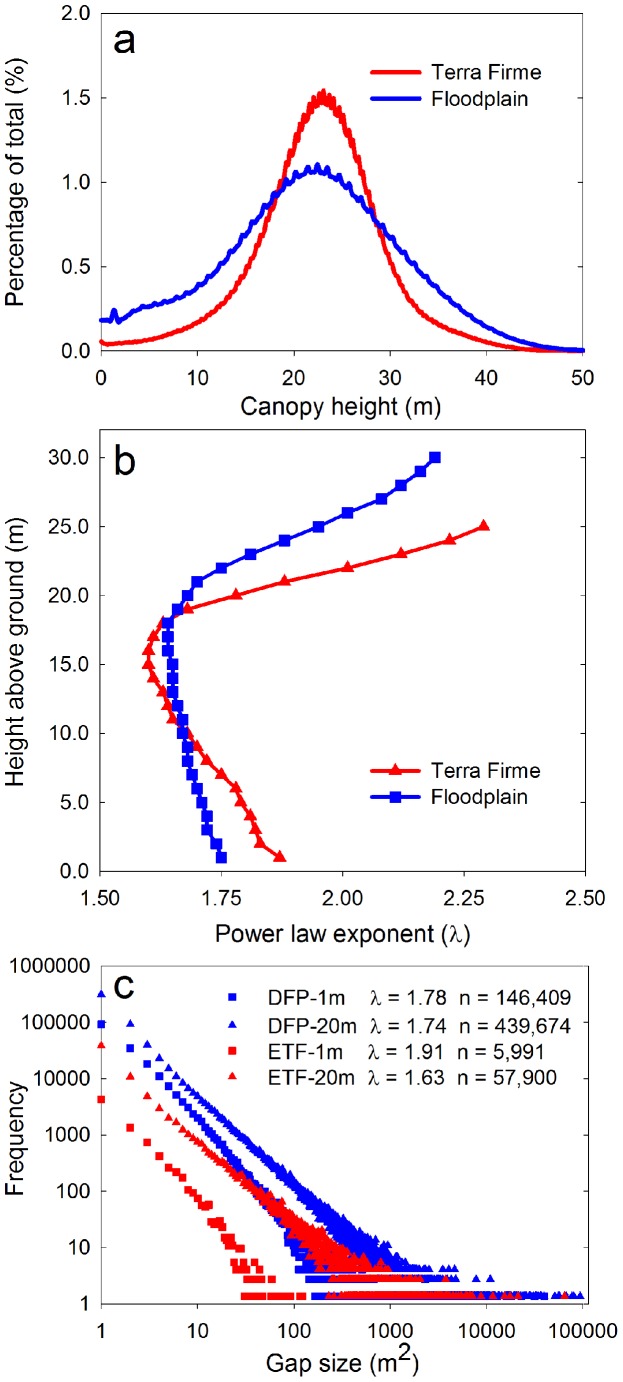
Figure 3. Canopy structure and gap statistics for CAO mapping block 12 including: (a) the distribution of canopy height for erosional terra firme (ETF) and depositional floodplain (DFP) forests (see Figure 2); (b) the vertical distribution of power-law exponents (λ) for each forest type in block 12; and (c) the gap-size frequency distributions for ETF and DFP forests for canopy gaps at <1 m and <20 m thresholds.
Power-law exponents (λ) and the number of mapped gaps (n) are also provided.

