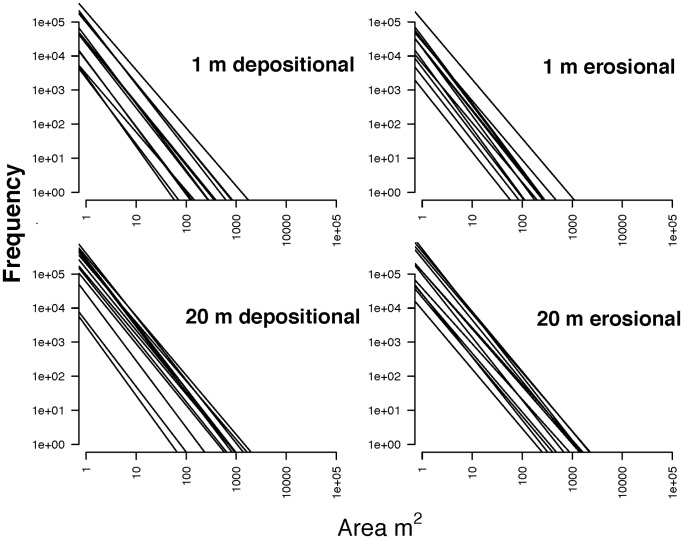
Figure 4. Graphical representation of size-frequency distributions of canopy gaps on erosional terra firme and depositional floodplain substrates in the southwestern Peruvian Amazon at two height thresholds.
The slopes of these lines are power-law exponents from the Zeta distribution that we estimated using maximum likelihood. Additional details are in Appendices S1 and S2.

