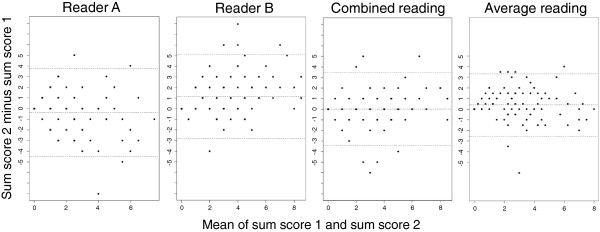
Figure 2.

Bland Altman plots of difference in MRI sum score between second and first evaluations. On 102 upper neck MRIs, two readers A and B independently graded the signal intensities of the alar and transverse ligaments on both sides of the spine (i.e. four ligament parts) on a scale of 0, 1, 2 or 3 and then resolved disagreements by consensus (combined reading). They also repeated the grading process (second evaluation). The sum of the scores for all ligament parts (MRI sum score, possible values 0–12) was calculated. In each plot, the difference between sum score 2 (second evaluation) and sum score 1 (first evaluation) is plotted against the mean of the two sum scores. Dotted lines represent mean difference and 95% limits of agreement. The plots show generally smaller differences for both readers’ combined reading and for the average of both readers’ scores (average reading) than for individual reader scores. Mean difference in sum score (with 95% limits of agreement) was for reader A −0.4 (−4.4, 3.7), reader B 1.2 (−2.7, 5.1), combined reading 0.0 (−3.4, 3.4) and average reading 0.4 (−2.5, 3.3).
