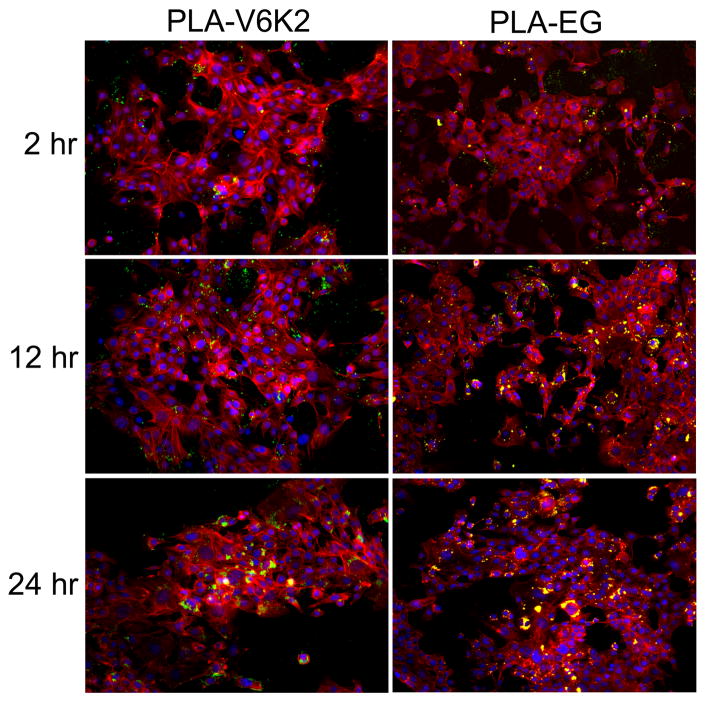
Figure 7.
Fluorescent images of FITC-labeled PLA-V6K2 (left column) and PLA-EG (right column) NPs incubated with 4T1 breast tumor cells after 2, 12 and 24 h. The cell nuclei and cytoskeleton were stained with DAPI (blue) and phalloidin (red), respectively; the insets in the 24 h images show 2X higher magnification of the stained cells and NPs. The FITC-loaded NPs can be seen as bright green or yellow (overlap of red and green) dots.

