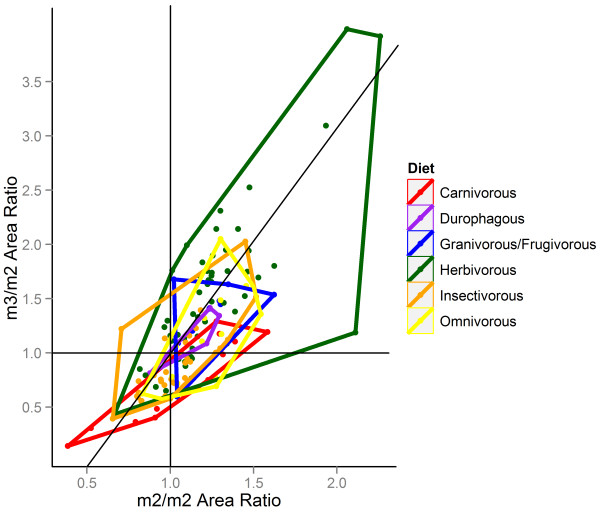
Figure 5.
Minimum area polygons for 132 genera divided into six dietary types. The data show a similarity to the predicted distribution from Kavanagh et al.[8], with more faunivorous dietary types placed in the bottom left of the morphospace, and more herbivorous dietary types in the top right.

