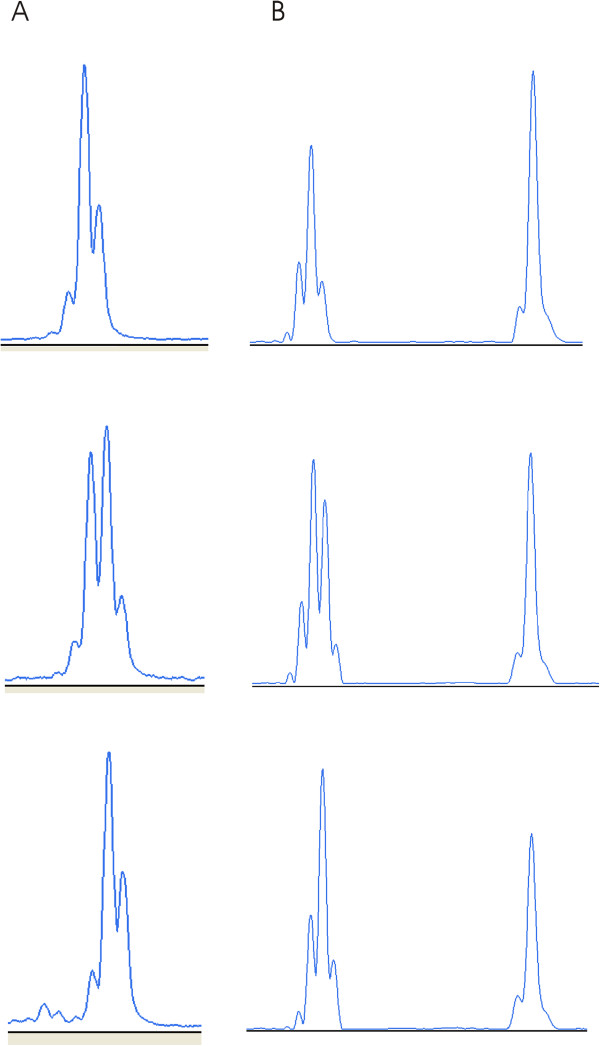
Figure 1.
Analysis of the germline EGFR 3′UTR polyA repeat polymorphism, using fluorescent multiplex PCR. A: Representative patterns obtained with cloned and sequenced amplicons corresponding to A13, A13/A14 and A14 repeats, from top to bottom. B: Representative patterns obtained with genomic DNA extracted from non malignant colorectal tissues corresponding to A13, A13/A14 and A14 repeats, from top to bottom; the peak to the right corresponds to the control (PCBD2) gene.

