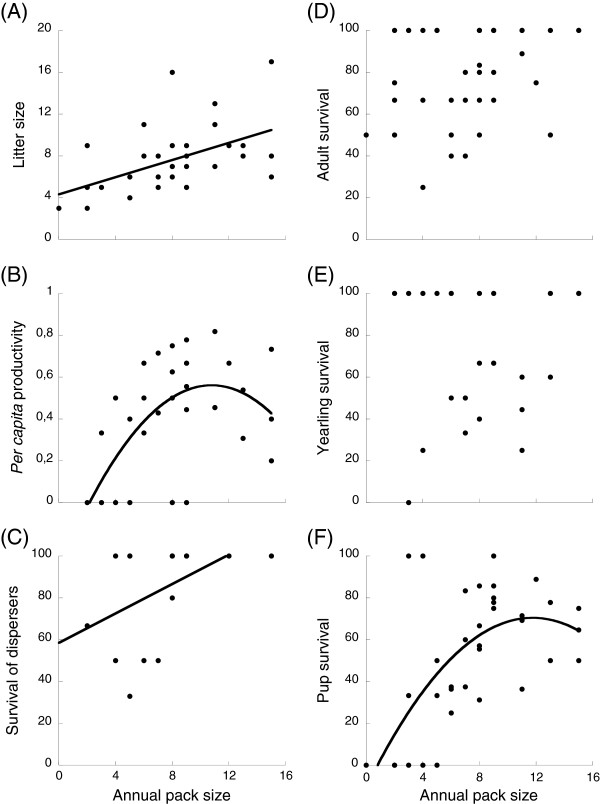
Figure 2.
Relationships between annual individual fitness and annual pack size in Lycaon. (A) Litter size, (B) per capita productivity, (C) survival of dispersers, (D) survival of adults, (E) survival of yearlings and (F) survival of pups. Circles represent observed values for each pack in each year. Model fits revealing component Allee effects are shown when statistically significant. Fits correspond to a simple linear regression of raw data, not to the fits for the generalized linear models.

