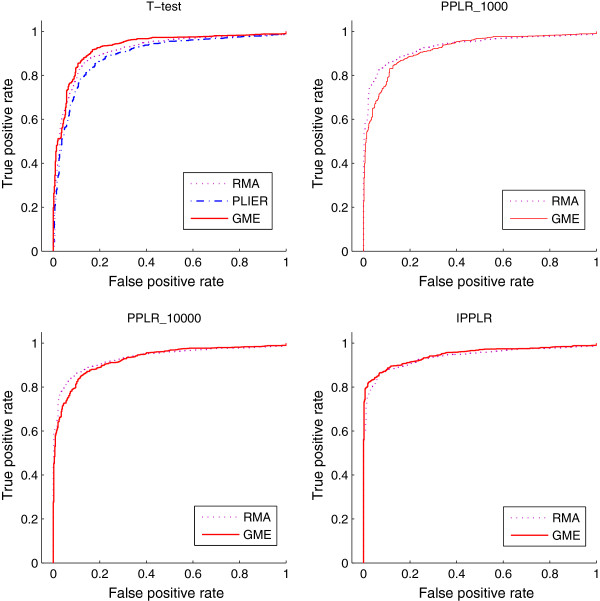
Figure 2.
ROC curves from different methods for 2-replicate Exon array data. The ROC curves are obtained from the average over the 5 runs each of which randomly selects two replicates. Gene expression estimation methods RMA, PLIER and GMA, are combined with different finding-DE-gene methods, t-test, PPLR and IPPLR. PLIER provides only a point estimate for gene expression and therefore is not applicable to PPLR and IPPLR. The number after PPLR indicates the sample number used in the importance sampling of the algorithm.

