
Figure 8.
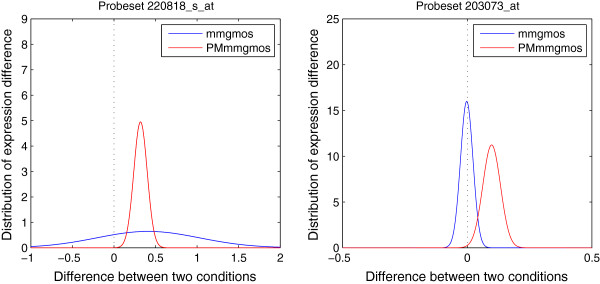
Distribution of expression difference between two conditions for U133 GeneChip data. Probe-set 220818_s_at is a low expression DE gene and probe-set 203073_at is a relatively highly expressed non-DE gene. The blue lines stand for the distributions of expression difference between two conditions calculated from multi-mgMOS and the red lines for PM-only multi-mgMOS.