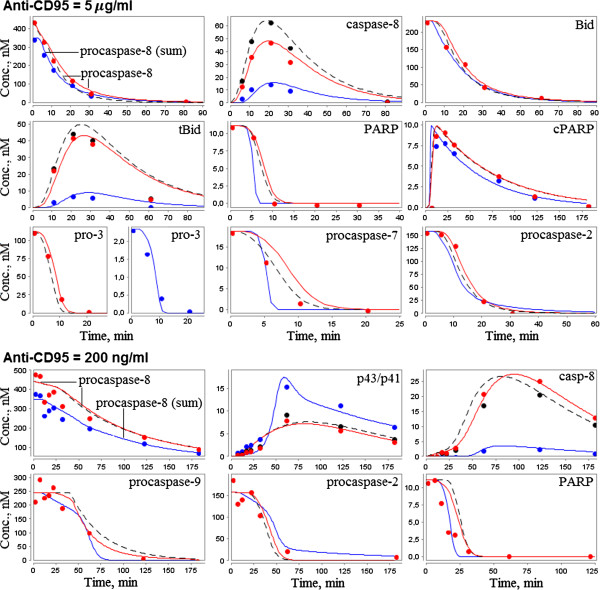
Figure 5.

Results of the composite model approximation to the experimental data by Bentele et al. The experimental data (dots) were obtained by Bentele et al.[17] using Western blot analysis and expressed as relative values. Once simulated values (curves in the figure) were found for the original Bentele’s model (solid red), the reduced model (dashed black) and the composite model (solid blue), experimental points were recalculated taking into account these values. Wherever blue or black dots are missing, they coincide with the red dots. Note that considering the concentration of procaspase-8 in the original model, we observed experimental dynamics for the separate species only, but not for the total amount as expected from experiments. Thus, validating parameters of the composite model, we evaluated the total amount of procaspase-8.
