Table 5.
Analysis of predictions regarding apoptosis in HeLa cells as formulated by Neumann et al
| № | The composite model behavior | Predictions by Neumann et al. |
|---|---|---|
| 1* |
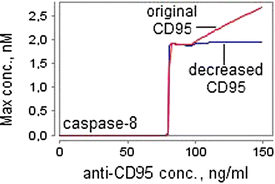 |
The concentration of anti-CD95 required for the apoptosis induction (the apoptotic threshold), is within the range of 30–100 ng/ml. This range remains the same for CD95 decreased by about 12-fold. The simulation time, which we used to reproduce this prediction, was 60 hours. |
| 2* |
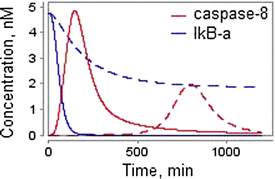 |
The decreased receptor number results in impairment of both CD95- and NF-κB-signaling pathways. To test this prediction, Neumann et al. considered levels of caspases-8 cleavage and IκB-α degradation for the original (solid lines) amount of CD95 and the amount decreased by about 12-fold (dashed lines). The concentration of anti-CD95 was 500 ng/ml. |
| 3* |
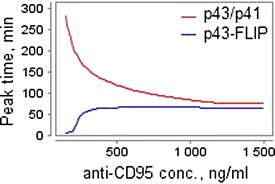 |
Along with increasing the concentration of anti-CD95 from 500 ng/ml to 1500 ng/ml, p43/p41 peaks earlier, while there is almost no difference for p43-FLIP. |
| 4 |
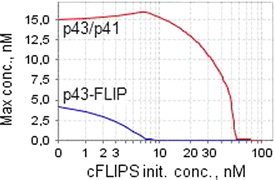 |
Increased concentrations of cFLIPS inhibit both apoptotic and NF-κB pathways, although p43-FLIP generation is inhibited at a lower threshold than p43/p41 generation. |
| 5* |
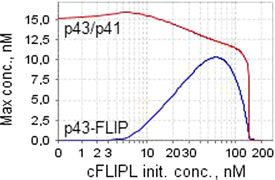 |
Increasing the concentration of cFLIPL leads to a steep increase in p43-FLIP generation until it reaches a maximum, after which the curve drops. Lowered levels of cFLIPL result in very little p43-FLIP but almost unchanged levels of p43/p41. |
| At very high concentrations of cFLIPL no p43-FLIP is generated. This drop-off was not observed experimentally by the authors. | ||
| 6* |
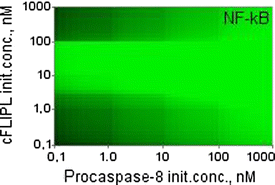 |
Only an intermediate level of cFLIPL promotes NF-kB activation. Decreased levels of procaspase-8 lead to a significantly lower amount of p43-FLIP and, subsequently, NF-κB. The figures show of logarithmic dependence of the maximal NF-κB concentration on the initial values of procaspase-8 and cFLIPL |
| 7* | 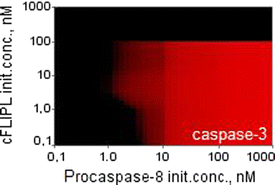 |
High cFLIPL or low procaspase-8 concentrations cause suppression of apoptosis. The figures show the same dependence as considered in the previous prediction, but with caspases-3 instead of NF-κB. |
All the predictions marked with an asterisk were experimentally tested by Neumann et al. and confirmed, unless otherwise noted. The simulation time in predictions 3–7 was 360 min. The concentration of anti-CD95 considered by the authors in predictions 4–7 was 1000 ng/ml.
