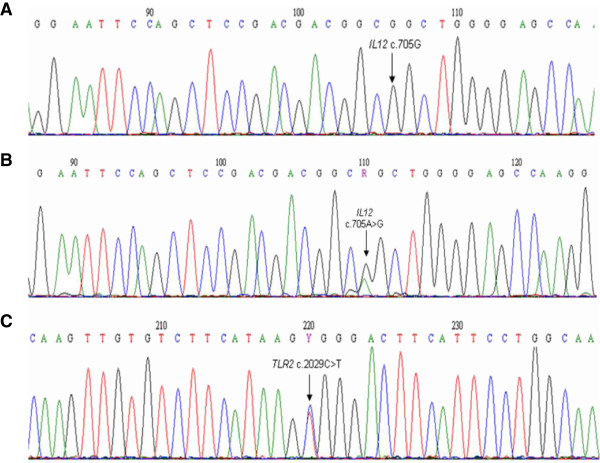
Figure 2.
Electropherograms obtained from Sanger DNA sequencing. (A) and (B) corresponds to the DNA sequence flanking IL12 gene at c.705A>G, being the genotypes indicated by the arrow – GG and AG – respectively. (C) Corresponds to the DNA sequence flanking TLR2 at c.2029C>T. The arrow indicates the genotype CT.

